Markets have continued to be driven by major macro-economic shocks in April. Some asset prices have become very volatile, while others (real and nominal bond yields) have been trending strongly in one direction, with little short term volatility.
Some thoughts:
- Most commentators believe that the main market driver during April has been a further large hawkish shock from the Fed. Three successive 50 basis point (“bp”) rate hikes are now priced by the markets in the next three Federal Open Market Committee (“FOMC”) meetings, with policy rates expected to peak at 0-3.5% in 2024. The FOMC has also warned of an early end to Quantitative Easing (“QE”). The Fed will start to sell bonds at a pace of around $95bn per month in June, and the central bank balance sheet is likely to decline at almost twice the pace seen in the last period of Quantitative Tightening (“QT”) from 2017-19.
- Recently, this policy shift has been reflected in a major uptrend in real bond yields, with expected inflation remaining broadly constant since early March (see Appendix below for our model’s latest results on this). The markets seem to believe that policy interest rates will “normalise” rapidly, without this causing a recession in the US or EU. Meanwhile, US fiscal policy is also likely to start tightening from now This combined tightening of interest rate policy, Fed balance sheet policy and fiscal policy represents an unusually sharp reversal in demand management policy.
- Nevertheless, there is general agreement that the US economy remains strong for now, with a low probability (15%) of a recession this By contrast, there is increasing recognition that a recession in 2023 is fairly likely. Goldman Sachs says the probability is 35%, while Fed Chairman Powell says that he hopes to avoid a recession, but this will not be easy. Larry Summers, the leading pessimist, argues that a recession will now be hard to avoid. Bill Dudley (former President of the New York Fed) agrees with Summers and contends that it could be a deep recession. He compares the current situation to the mid-1970s, and concludes that any delay in tightening monetary policy now will lead to a deeper recession later.
- Our view remains towards the more pessimistic end of this wide spectrum of opinion, though there is huge uncertainty on this call, given the unique economic circumstances that are in Experience from previous cycles does not give a very dependable guide to the likelihood of recession in the next 2 years.
- If the US and EU are to avoid recessions, the inflation shock needs to start reversing soon, so that the annual rate of inflation can decline automatically, and the Fed/European Central Bank (“ECB”) can become less This will
depend on the labour market, the recovery of supply chains from China and developments in the Ukraine war. All still look problematic.
- The US labour market is much tighter than it has been at any time since 1945, and the labour force still remains well below pre-pandemic trends (see graph below from the Wall Street Journal). This has caused wage inflation to rise to around 5.5%. This rate of increase is clearly incompatible with the Fed’s 2% inflation objective and is the major issue that the central bank is trying (belatedly) to It will be difficult to achieve a “small” rise in unemployment without this turning into a large correction in the labour market and therefore a recession.
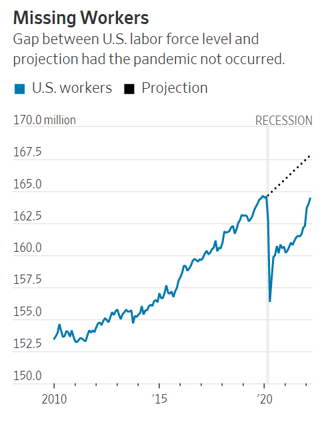
Source: Labor Department; projection is researchers’ estimates based on 2015-19 trends
- Economic activity in China has dropped sharply in March/April, reflecting the almost complete shutdown in Shanghai and some other cities. For now, the authorities are maintaining the zero Covid strategy which will cause further lockdowns in many other regions in coming The government is maintaining its GDP target of “around 5.5%” this year, but this looks increasingly unlikely to be attained. Having said that, progressive easing in monetary and fiscal policy – the exact opposite of the policy stance in the US – should prevent any further decline in the annualised growth rate after the second quarter.
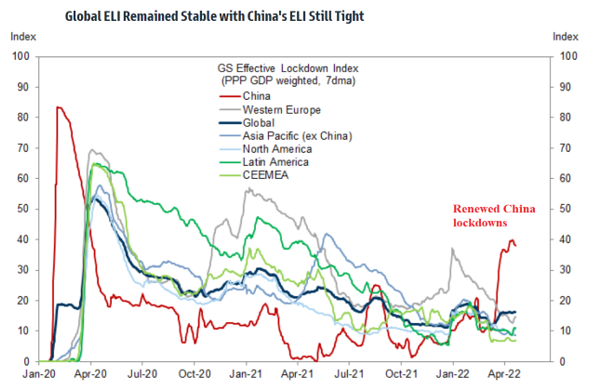 Source: Goldman Sachs Global Investment Research, University of Oxford (covidtracker.bsg.ox.ac.uk), Google LLC *Google COVID-19 Community Mobility Reports*,Wind
GS stands for Goldman Sachs; ELI stands for Effective Lockdown Index; PPP stands for Purchasing Power Parity; GDP stands for Gross Domestic Product; DMA stands for Daily Moving Average; CEEMEA stands for Central and Eastern Europe Middle East and Africa.
- In currency markets, the dollar has strengthened further during April, reflecting the relative hawkishness of the Fed compared to other central Recent weakness has been particularly notable in the yen and sterling, where the central banks are clearly less hawkish than the Fed. Importantly, the Chinese RMB has suddenly started to weaken in recent days, and this has been tolerated (or even encouraged) by the People’s Bank of China (“PBOC”). The decline in the RMB reflects the impact of a depreciation in the yen, weakness in economic activity in China, and capital outflows linked to bond market stress. This reversal in the RMB could be a major factor in currency markets in coming months, likely fuelling further dollar strength.
- After a few weeks in which equity markets seemed surprisingly resilient to Fed tightening, there has been some marked weakness in the last few The S&P 5001 is now down 9.5% this year; the Nasdaq2 is down 16.9% (as at 25th April 2022). These markets are now close to their low points for the year.
- Last week, the major shock was obviously the outright collapse in one of the largest streaming services’ share price, which may cause a general rethink of long term equity valuations in “tech” sectors, given the rise in real bond Equities are likely to remain vulnerable until the Fed shock is fully priced, and recession risks are seen to drop. This process could take several quarters to play out.
APPENDIX ON SHOCKS AND THE FINANCIAL MARKETS
Fulcrum economists, led by Juan Antolin-Diaz, have developed a Value At Risk (“VAR”) model of the US financial markets that enables us to track on a daily basis the fundamental macro shocks that are moving the major asset prices over any given time period.
This model has been very useful in helping us to understand asset market behaviour in the past few years. It enables us to identify the following major shocks in the US and global economies: Fed conventional monetary policy (MP); unconventional monetary policy (UMP); financial market risk aversion (RISK); oil supply (OIL); US domestic demand (DD); global demand (DD); and US non oil supply (SUPPLY). It also shows a residual (grey boxes) that represents unidentified market shifts, not attributable to any of the specific shocks.
The graph below shows the model’s estimates of the impact of weekly shocks on real yields in the TIPS market, cumulated from end 2021 onwards. The shocks are compared with the path for real yields expected by the model at end 2021, which is shown by the dotted line. Therefore the graph shows how the model has been “surprised” by new shocks in 2022, and identifies the main categories of these shocks.
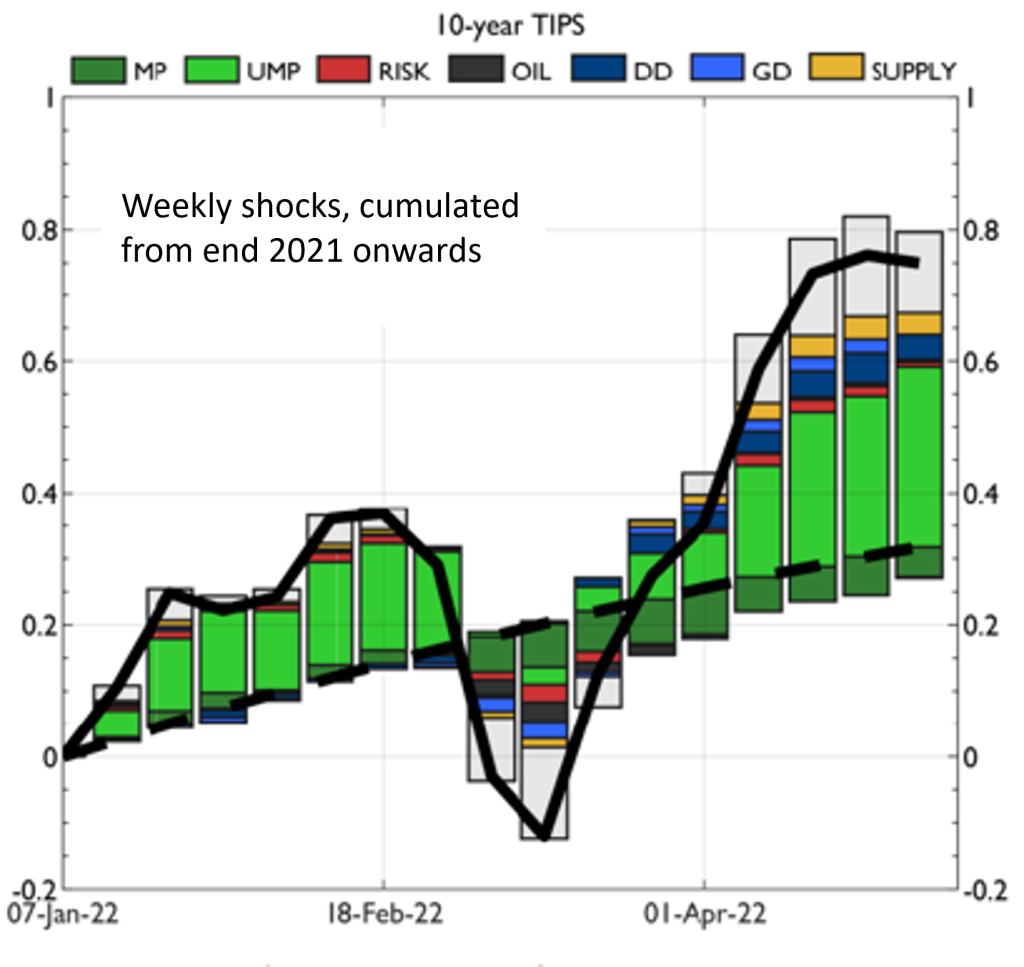
Source: Fulcrum Economics Department
At the end of last year, the model “expected” real TIPS yields to rise by 0.3% by the end of April 2022. This mainly reflects the fading out of extremely easy monetary policy that was pursued by the Fed throughout last year. On top of this “expected” rise in yields, we have seen a further 0.5% increase, much of which has happened in April. About half of this further increase has been due to unconventional monetary tightening, which represents the change in Fed balance sheet policy. The model suggests that this has been the main driving force in the increase in real (and therefore nominal) bond yields in the past few weeks.
Glossary
Basis points – a unit of measurement. One basis point is equal 1/100th of 1%, or 0.01%, or 0.0001, and is used to denote the percentage change in a financial instrument.
Gross Domestic Product (GDP) – total monetary or market value of all the finished goods and services produced within a
country’s borders in a specific time period.
GS Effective Lockdown Index – a combination of official restrictions and actual mobility data from 46 economies, weighted by PPP GDP.
Purchasing Power Parity (PPP) – an economic theory that compares different countries’ currencies through a “basket of goods” approach.
Value At Risk – a statistic that quantifies the extent of possible financial losses within a firm, portfolio, or position over a specific time frame.