Powell, the markets and financial conditions
The powerful rally in global stocks and bonds in recent weeks has produced a strong bounce back in the performance of 60% equities/40% fixed income (60/40) investment strategies, taking the total return on 60/40 funds to 9% year-to-date. This repairs around half of the losses incurred by these strategies in 2022 and reflects improvements in the supply side of the global economy driven recently by lower oil prices (which have surprised us, in view of Middle East uncertainties) and improvements in labour force growth, notably in the US.
In previous editions of this publication, we have argued that ongoing improvements in the supply side of the world economy have resulted in a soft landing, at least in the US, becoming the most likely scenario that will drive markets and asset performance in the next few months. Currently, we place a subjective probability of 60% on a soft landing, 25% on a “no landing” scenario, and 15% on a hard landing. As a reminder, these probabilities relate to the possible shocks that may determine market changes in coming months, rather than the final outcome of the current economic cycle on a longer-term view. Eventually, all economic recoveries end with a recession!
Although fundamental economic shocks have proved to be critical in determining market performance throughout this year, a further important factor has been the guidance about Federal Reserve policy that has been offered in successive statements by Fed chair Jerome Powell. In retrospect, the most important of these was his interview at the New York Economic Club on 19 October, when he said clearly for the first time that the outlook for Fed policy rates could be affected by the rise in long term bond yields and the consequent tightening in US financial conditions.
Since these remarks, the market has become more optimistic about Fed policy, and the US government bond yields have moved downwards by around 40 basis points throughout the curve. When Chair Powell followed these remarks with an optimistic assessment of US supply side improvements at the FOMC press conference on 1 November, the equity market also entered a period of strong recovery, reflecting a perceived improvement in the probability of a soft landing.
The increasing importance of financial conditions in influencing Powell’s views on the setting of policy rates is illustrated by the increased word count for the term “financial conditions” in FOMC minutes and press conferences over the past two years. (See Graph 1.) In view of these trends, economists and risk takers have been increasingly focused on what the Fed chair means by “financial conditions”, and by the slightly different concept of “financial conditions indexes”. The remainder of this note is dedicated to examining this subject.
Graph 1: Mentions of “Financial Conditions” in Fed communications
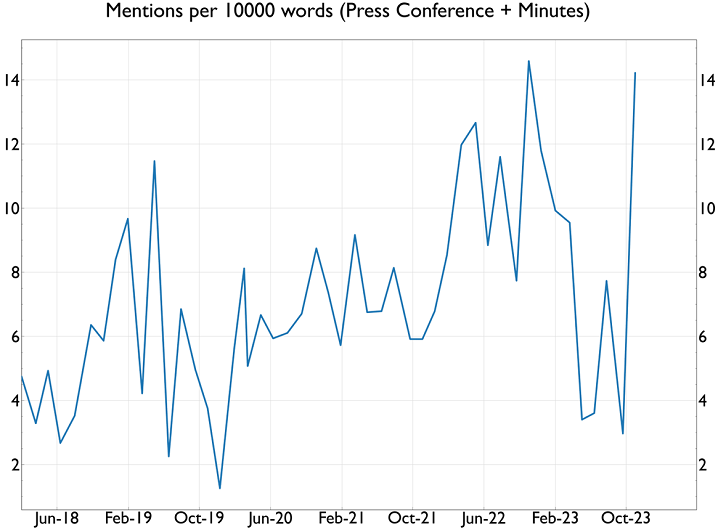
Source: Fulcrum Asset Management
What are financial conditions?
The use of monetary conditions indexes extends back to the 1980s, when indexes of policy rates and the exchange rate were introduced by the Bank of Canada. I am informed by a highly experienced former Fed economist that the wider term “financial conditions” was in use within the US central bank in the early 1990s, if not before. However, I believe that the concept really gained traction in the markets with the publication of economic research on the subject by my colleagues Bill Dudley and Jan Hatzius at Goldman Sachs later in that decade. These two economists subsequently became President of the New York Fed and Chief Economist of Goldman Sachs, respectively. (With colleagues like these, who needs to work hard?)
In a recent column in Bloomberg Opinion, Bill Dudley has written the following:
Lately, Federal Reserve officials have been paying greater attention to financial conditions – that is, to the influence that market phenomena such as stock prices, bond yields and housing prices have on economic activity, above and beyond the effect of the short-term interest rates that the central bank controls directly.
Such indicators are crucial, because monetary policy does not operate exclusively through short-term interest rates, particularly in the US. A lot of financial intermediation happens outside the traditional banking system.
Financial conditions wouldn’t merit much attention on their own if they always moved in lockstep with the Fed’s short-term interest-rate target. They don’t.
The stock market can rally or fall independent of short-term rates. The dollar’s value can change depending on economic activity abroad and how that affects monetary policy elsewhere. Distress in the banking system can tighten financial conditions independently, as happened when a group of regional US lenders ran into trouble this spring.
This excerpt from Dudley’s most recent writing on financial conditions neatly summarises his view. He and many others believe that central bank policy variables (i.e., policy rates and the central bank balance sheet) can influence the economy directly, but they also influence broader financial conditions, including asset prices and credit conditions, which in turn impact the economy indirectly.
The channels through which financial conditions can influence the economy are many and varied. Some economists tend to emphasise the cost-of-capital route, which affects spending on capital investment, housing, and consumer durables. In addition, equity prices have been shown in many research papers to have a significant effect on consumer spending via wealth effects. The real level of the dollar clearly impacts GDP through its impact on net trade. And credit conditions, as proxied by credit spreads, will have a large effect both on the availability and price of credit to small companies and households.
The fact that monetary policy works in part through these indirect effects on asset markets is by now almost completely uncontroversial in markets and policy circles. This is routinely accepted both in speeches by FOMC officials and Fed economists. However, that is where the unanimity ends. Economists and market commentators differ widely on how to measure “financial conditions”, how to take account of lags between financial conditions and the economy, and how to change policy rates to reinforce or offset the impact of shocks in financial conditions. For real life policy discussions, this is where the rubber hits the road.
Financial conditions indicators or indexes
Macro economists have always tried to produce indexes or indicators in order to measure and summarise important concepts that help to understand the economy. In general, these are based in part on economic theory that determines what should be included in the index. For example, inflation is measured by indexes that use expenditure weights to aggregate thousands of different individual prices into a single number.
It is accepted that all “consumer goods and services” should be included. Asset prices are therefore excluded. But what about housing? In the US, the CPI and the Personal Consumption Expenditure (PCE) indexes that report on “inflation” each month take very different views on how to measure housing or shelter inflation, and this can result in significant differences between the two indexes over short periods.
The measurement of Gross Domestic Product (GDP) is also subject to ambiguities. Conceptually, GDP is a measure of the quantity of all goods and services produced in the economy, measured at nominal prices over a given period, and real GDP is that nominal quantity deflated by a price index. But the three different methods of defining GDP – based on production, income, and expenditure estimates – result in very different estimates, even though they are conceptually the same.
The price deflators that are needed to produce indexes for inflation and real GDP require methods to allow for quality improvements in the nature of the items being measured. It stretches credulity to believe that today’s iPhone can be accurately compared with an early satellite phone.
Then there are those goods and services that cannot be measured according to market prices. Some of these, such as public education and health services, are measured by estimating inputs of labour, not outputs of the service themselves. Other non-market services, such as those that take place informally within a single household, are not measured at all. If a household member stays at home to look after other household members, including children, their contribution to GDP is counted as zero. On the other hand, if they hire a helper in the labour market, then GDP is directly boosted.
None of these well-known issues that plague the creation of indexes prevent economists from focusing huge attention on the CPI, GDP or unemployment rate, and many other indexes. The items included in these measures are not exactly apples-to-apples so there is an element of adding apples to oranges, using assumptions to turn the combination into a single number.
The question is whether it is possible to do the same with the various items that are usually included in the term “financial conditions”. Most economists believe that the items included in the CPI or GDP indexes are very similar to each other, so it is appropriate to aggregate them in a suitably weighted index (somewhat like adding apples to apples). Many of these economists think that the variables that influence “financial conditions” are not sufficiently alike to be aggregated into a single index (more like adding apples and oranges). Although this debate can become very abstruse, these sceptical opinions about FCIs are firmly held. Nevertheless, the proliferation of alternative versions of FCIs has been a major growth industry this century!
Bill Dudley again:
Nearly 25 years ago, when I was chief US economist at Goldman Sachs, my colleague Jan Hatzius and I created a financial conditions index as a tool for assessing the economic outlook and the appropriateness of the Fed’s monetary policy stance. While its construction has evolved considerably since then, the conceptual framework remains intact. Over the years, many others developed comparable indexes. This summer, the Fed introduced a new one of its own.
The main FCIs in current use
The original GSFCI and the two new Fed measures (FCI-G, with different lookback periods) have included similar variables in their definition of “financial conditions” and have also adopted a common idea to produce weights for an index that measures these conditions. The main variables included are: policy interest rates, long-dated government bond yields, credit spreads, equity prices and the exchange rate. The FCI-G measures also contain house prices and mortgage rates, which are not included in the main version of the GSFCI.
The weights that are attached to the various components used to calculate these measures are designed to reflect the impact of each of them on future US GDP growth. This is intended to overcome the problem of adding apples to oranges. Both the FCI-G and the original GSFCI used simulations on the Fed Board’s FRB/US model to estimate the weights. This model has been in use since 1996 to forecast the economy and conduct policy simulations. It is a large-scale general equilibrium model that can produce detailed forecasts for the economy based on a flexible view of optimizing behaviour by firms and households, while allowing for the formation of realistic expectations for all agents in the economy. It is therefore the “workhorse” model used within the Board of Governors. (FCI-G also uses other models within the Fed to estimate the impact of house prices and mortgage rates on GDP growth.)
The modern version of the GSFCI uses a similar approach but the specific weights are now calculated from a smaller macro model estimated within Goldman Sachs (GS), instead of the FRB/US model. The resulting index is calculated in units that are designed to reflect changes in financial conditions on a real time basis, based almost entirely on very recent changes in asset prices. (The average GS-FCI from 2000-present is set equal to 100.).
There are no major lags built into the GS calculation, so the index moves every day with shifts in asset prices, especially government bonds yields and equity prices. Policy rates and the dollar, which are also included in the index, have smaller direct effects on the FCI. A one-point increase in the GSFCI is estimated by Goldman Sachs to reduce GDP growth in one year by 1 percentage point.
The FCI-Gs automatically build in persistence because the financial variables included in the figures incorporate lags of up to one year and three years in the alternative versions of the index (FCI-G 1-year and FCI-G 3-year, respectively.) This means that the FCI-Gs respond fairly slowly to persistent changes in asset prices, which is a feature that is clearly attractive for Fed policy makers, though in practice their policy guidance seems to change considerably when asset prices shift a lot over short periods. The FCI-Gs are calibrated to show the expected effects of current and lagged changes in financial conditions on GDP growth one year ahead. This objective is similar in many ways to the aim of the GSFCI, though the lagged financial inputs to the FCI-Gs mean that the degree of persistence is greater in the Fed series (see Graphs 2 and 3).
Graph 2: Common measures of financial conditions: GSFCI, FCI-G (1-year) and FCI-G (3-year)
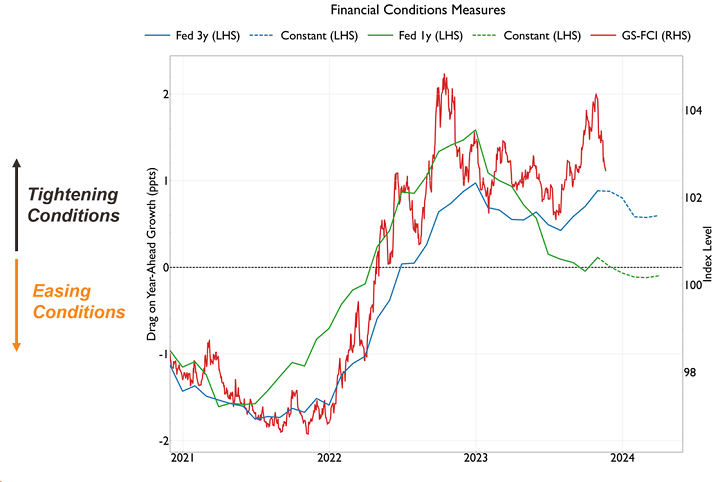
Source: Fulcrum Asset Management, Haver Analytics, Goldman Sachs
Graph 3: Range of common FCIs
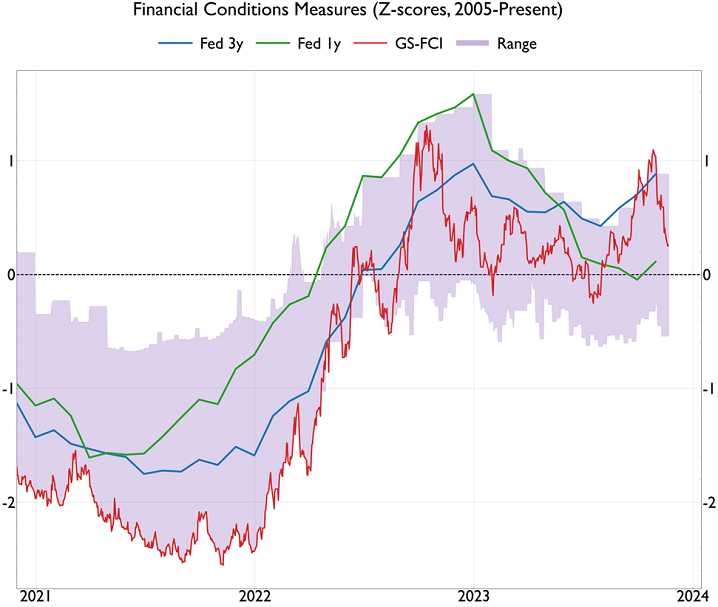
Source: Fulcrum Asset Management, Haver Analytics, Goldman Sachs
Neither the GSFCI nor the FCI-Gs include any direct measures of financial stress, or market liquidity. Nor do they include other intermediate variables that might affect the transmission of policy rates into the economy, including credit availability, money supply growth and the central bank’s balance sheet. They should therefore be viewed as limited to the transmission of monetary policy that occurs via asset markets. While this is arguably the closest and most important part of the transmission mechanism to the policy variable itself, it is obviously not the only one that policy makers need to consider in practice.
This is why there are other FCI indexes calculated by regional reserve banks within the Fed system that can add information about other parts of the wider transmission mechanism of monetary policy. Perhaps the most often quoted such index is the Chicago Fed’s National FCI, which includes about 100 variables, including many that relate to stress and liquidity within the financial system itself. The method of calculation for this index is not directly related to GDP growth. Instead, a common factor for an unobserved variable (“financial conditions”) is estimated using a dynamic factor model, similar to methods used for GDP nowcasting. Strictly, this index is intended to measure financial stability or stress rather than financial conditions, but the authors claim that it does help to forecast economic activity. Bloomberg offers a similar index calculated daily.
There are also many other attempts to calculate financial conditions indexes, though those mentioned above are probably the leaders in the field at present. There are diminishing returns to adding further estimates of the FCI, so we focus on the three main indexes mentioned above, while showing the range of other estimates. The Chicago National FCI and the Bloomberg index would be viewed as more significant at times of financial stress (Graphs 4 and 5).
Graph 4: FCIs including financial stress variables, Z-score (1)
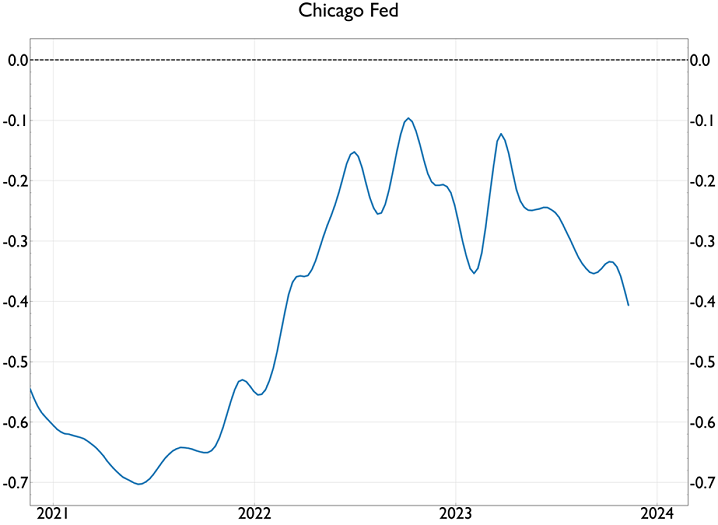
Source: Fulcrum Asset Management, Haver Analytics
Graph 5: FCIs including financial stress variables, Z-score (2)
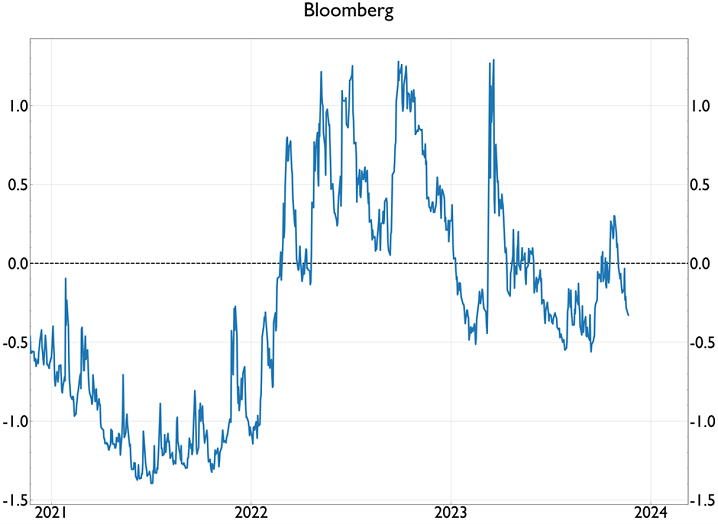
Source: Fulcrum Asset Management, Haver Analytics
Graph 6: Variables included in different FCI measures
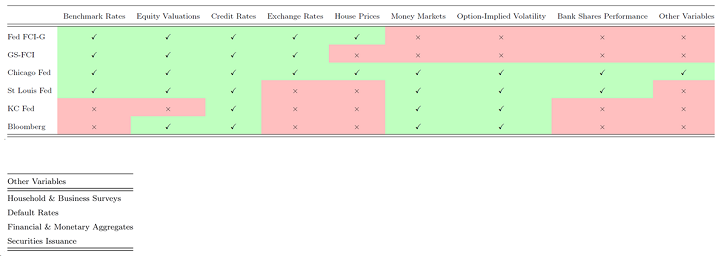
Source: Fulcrum Asset Management
Drawbacks of financial conditions indexes
Apart from the problems associated with the selection and weighting of the specific financial variables that are included or excluded in any given index, other drawbacks of FCIs have been debated among economists. Some of the issues that are frequently raised are the following:
- The asset prices included in the FCIs are usually expressed in nominal units and are therefore not adjusted for inflation. This is not a very significant issue when inflation is low and stable, as it was in the two decades prior to 2019. But it could lead to serious distortions when inflation unexpectedly rises sharply, as it did in 2021-22. In that period, for example, nominal bond yields increased much more rapidly than real yields, which might mean that the restrictive effect on the economy was smaller than implied by the standard FCIs.
- The FCIs fail to take any account of the possible changes in equilibrium interest rate (known as r*) that may have taken place since the pandemic. If r* has increased because of more expansionary fiscal policy and higher public debt ratios, then the effect of any given level of the FCI in restricting economic activity may be less than before.
- The relationship between FCIs and economic variables may work in both directions. For example, if an expansionary demand shock increases expected GDP growth, then higher bond yields and a firmer dollar may cause a tightening in FCIs. But this would not represent an exogenous tightening in the transmission of monetary policy that might need to be offset by the Fed.
These and other possible drawbacks need to be considered when using FCIs in practice to gauge central bank policy decisions. Before the pandemic, Jan Hatzius of Goldman Sachs argued here that several of these drawbacks are invalid, or should be seen in a wider context. Since the pandemic, this conclusion is more debatable, but Chair Powell certainly seems willing to take FCIs seriously in present circumstances. If he is willing to do so, we have no choice but to follow suit.
Fulcrum’s asset price “Shock” models and the FCI
As an alternative simply to using headline measures of the FCI, Fulcrum has for many years used our own asset price “shock” models to assess the underlying fundamental shocks that change financial conditions. The underlying economic shocks include domestic demand (from a US perspective), global demand and supply, monetary policy (both conventional and unconventional), oil prices and risk appetite. Once we have estimated the combination of shocks that has impacted each of the major asset markets, we can use GSFCI weights to show how that index may have been impacted by each of the underlying shocks.
This methodology shows that much of the tightening in the GSFCI from late July to its peak in late October was driven by unconventional monetary policy tightening (i.e., higher bond yields due to increased term premia – see Graphs 7 and 8) and higher oil prices. No surprises there.
Graph 7: Fulcrum’s Asset Price Shock Model – Impact of Shocks on the FCI (Index Points)
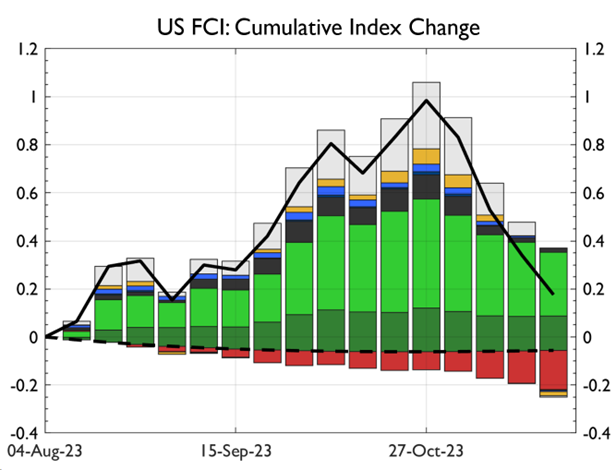
Source: Fulcrum Asset Management
Note: The bars represent the contributions from the following fundamental shocks: light green – conventional monetary policy, dark green – unconventional monetary policy, black – oil supply, red – risk aversion, yellow – supply, light blue – global demand, dark blue – domestic demand, grey – residual component not attributable to other shocks.
Graph 8: The term premium on 10-year US Treasuries
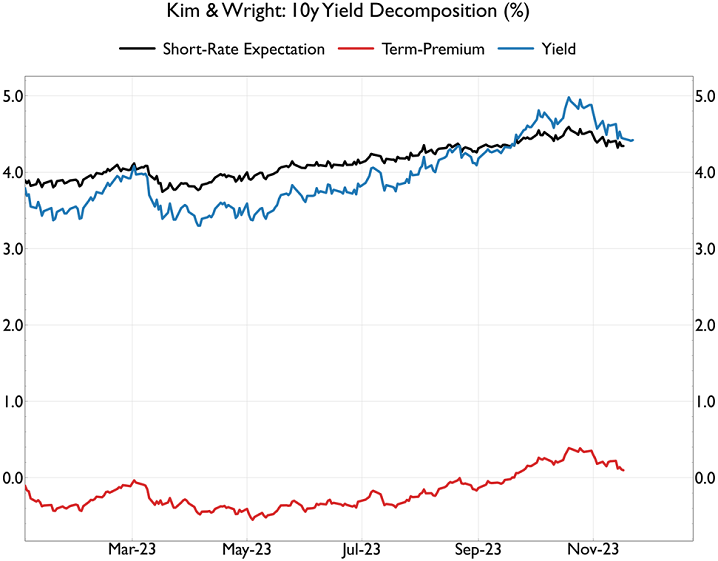
Source: Fulcrum Asset Management, Haver Analytics
In addition, there was a significant part of the tightening in financial conditions that was driven by factors that the model could not allocate to specific macro shocks. This sometimes indicates that part of the shift in asset prices is irrational or is due to new factors that the model does not incorporate.
The model also reports on the shocks that may have caused the easing in financial conditions since late October. The main three factors that had caused the earlier tightening in FCIs have now all reversed – unconventional monetary policy (think “the term premium”) has eased, oil prices have declined markedly and the unexplained residual in the model has returned to zero.
It is easy to see why markets may have increased the probability of a soft landing in response to these shocks. Lower oil prices have, as usual, been reflected in lower breakeven inflation rates in the bond market. This, together with the associated easing in financial conditions, driven by the lower term premium, has reduced the probability of a damaging clash between tighter policy and rising inflation pressures. Therefore, the shift in market pricing towards a soft landing seems justified – unless the Fed chooses to correct this benign interpretation of recent events.
Chair Powell’s recent comments about financial conditions
As noted above, the main reason for increased market attention on the FCI recently has been the surprising clarity of the remarks made by Fed Chair Powell about the concept, and its importance for policy rates. This has come in two stages.
At the New York Economic Club on 20 October, Powell said that financial conditions had tightened because of rising bond yields, driven by the term premium, and that this tightening could replace the need for higher policy rates.
He followed this with even clearer remarks about financial conditions and the FCI in the FOMC press conference on 1 November.
On financial conditions, his prepared FOMC statement said the following about financial conditions:
Financial conditions have tightened significantly in recent months, driven by higher longer-term bond yields, among other factors. Because persistent changes in financial conditions can have implications for the path of monetary policy, we monitor financial developments closely.
He then proceeded to explain that there are two conditions under which tighter financial conditions could matter for future policy rate decisions:
The first is that the tighter conditions would need to be persistent and that is something that remains to be seen…With financial conditions, we’re looking for persistent changes that are material.
The second thing is that the longer-term rates that have moved up, they can’t simply be a reflection of expected policy moves from us that we would then, that if we didn’t follow through on them, then the rates would come back down. So, and I would say on that, it does not appear that an expectation of higher near-term policy rates is causing the increase in longer-term rates.
On the exact definition of the FCI, the Fed Chair was equally explicit:
We look at a very wide range of financial conditions and in fact, as you’ll know, different organizations publish different financial conditions indexes which can have seven or eight variables, or they can have a hundred variables, so there’s a very rich environment, and we tend to look at…a few of the common ones that people look at. And so they’re looking at things like the level of the dollar, level of equity prices, the level of rates, the credit spreads, sometimes they’re pulling in credit availability, and things like that, so it isn’t any one thing. We would never look at for example, long-term treasury rates in isolation. Nor would we ignore them. But we would look at them as part of a broader picture and they do play a role of course, in many of the major standard financial condition indexes.
The definition of the FCI chosen by Powell was based around a monetary transmission mechanism that works via the major asset prices and does not focus too much on near-term stress within the financial or banking systems. Although he was unwilling to specify any particular index – which is wise for a Fed Chair who needs to retain policy flexibility – his language seems to point to a focus on the GSFCI and on the Fed’s FCI-G measures for current policy decisions. However, he also looks at a wide variety of other indexes, probably including some others produced within the Fed system. And his focus on financial stress would clearly increase markedly if market liquidity suddenly became much tighter, as captured, for example, in the Chicago Fed FCI.
Until the FCI is downgraded in Fed thinking, we intend to monitor the performance of the GSFCI, the two Fed FCI-G measures, and a range of other commonly quoted indexes, many produced within the Fed system. Powell will probably continue to use the collection of these indexes to reach his overall judgment on the behaviour of financial conditions and its importance for policy rates. He has also left himself the option of switching between the indexes whenever it suits his main narrative about monetary policy settings.
The Fed’s current interpretation of FCIs and policy rates
The Chair’s read on the appropriate level of the FCI, given the present economic situation, has already been challenged since his remarks at the FOMC meeting on 1 November, when he confirmed that persistent tightness in his overall assessment about financial conditions would raise the probability that policy rates would remain stable, instead of increasing, at the Fed’s December meeting. That is now fully priced in the market, but the apparently dovish shift in his rhetoric has also led to a fall in long dated bond yields and the dollar and a rise in equities, thus easing financial conditions. There was no indication that Powell wanted the FCI to ease in his remarks at the FOMC, and in his latest guidance (IMF speech, 9 November) he made a modest attempt to sound more hawkish. The markets, however, have ignored this latest minor shift and have instead been more impressed by the print for the October CPI, which was slightly better than expected.
The Fed’s FCI-Gs have not changed since 1 November and, by design, they will not change much even if all asset prices remain at their new levels for the next few months. This is because of the lags deliberately built into their construction.
However, the GSFCI has dropped by over 100 basis points since 1 December, eliminating about one half of the tightening in financial conditions that had caused Powell’s change of tone at the last policy meeting. This may have raised doubts in Powell’s mind about whether the late summer tightening in financial conditions will prove to be persistent.
Implications for the December FOMC meeting
The key question for monetary policy guidance ahead of and after the FMOC meeting on 12/13 December is whether the recent shift in the FCI, and other economic news, will persuade the Chair to make a serious effort to “correct” the easing in financial conditions that has now occurred. If so, the soft-landing rally in markets would be jeopardised before year end. This is likely to depend on three issues:
- Will the recent easing in the FCI undermine the belief that the summer tightening can be judged to be “persistent”? Powell has said repeatedly that he will only consider replacing the need for policy rates with a tightening in the FCI if he believes the latter to be “persistent”. This belief was encouraged by the simultaneous tightening in both the GSFC and the FCI-G (1-year) from July to October this year. There has been no easing yet in the FCI-G (1-year), which has some persistence built into its design. But the GSFCI has eased significantly, which points in the other direction. Overall, Powell is likely to have less confidence in the degree of persistent tightening than he had in early November, but the big picture probably still suggests to him that some persistent tightening in the FCI has occurred.
- Has the rise in bond yields been driven by the term premium? This is important because a rise in bond yields that has been caused by an increase in the expected path for short rates is not seen by Powell as a reason to do less than he previously intended on the policy rate. In fact, it might be seen as a reason to actually deliver the higher path for short rates that was built into bond yields. But this is not what has happened, either in the bear market phase for bond yields, or in the recent decline in yields. The term premium seems to have been responsible for the change in bond yields in both directions. The correct inference on this is therefore that Powell is likely to view any drop in the FCI as a genuine easing in policy conditions, which points in the direction of higher, not lower, short rates.
- Does any other incoming economic evidence change the amount of tightening in the FCI that was deemed necessary a month ago? Here the picture is mixed. Activity growth in 2023 Q4 has slowed, as the Fed expected, but recession or hard landing risks do not seem yet to have increased materially. Meanwhile the October CPI print came in lower than expected, but primarily because oil prices fell, and Powell has said that fluctuations in oil prices are not seen as very relevant for policy at present. Apart from oil prices, core service prices were slightly disappointing last month, but probably not enough to dislodge the Fed’s clear view that core inflation, and wage inflation, are both still moving lower.
Overall, our judgment is that these three changes in the flow of new information do not justify any significant easing in the FOMC’s overall view of its main policy guidance since the November meeting. In fact, the market may now have eased the FCI by more than Powell would ideally like to see at this stage. This suggests that FOMC members may try to “correct” some or all of the FCI easing in coming weeks, though it is important to realise that this situation will not be seen by policy makers as particularly urgent. As they keep reminding us, policy is restrictive, and they have earned the right to watch and wait for more data.