The Taylor Rule and Policy Tightness in the US
The outcome of the FOMC meeting on 13 December, both in terms of what Chair Powell said at the press conference and what the new economic forecasts projected, represent the most dovish guidance seen from the Fed since the inflation scare arrived in the summer of 2021.
To understand the reasons for this sudden lurch in policy, I have prepared Table 1 below, which shows how the Fed’s economic projections have developed in the past few months, along with a Taylor Rule estimate for the degree of policy tightness that is implied by the new economic projections and the policy rate forecasts.
The methodology used is similar to that suggested by Glenn Rudebusch when he was at the San Francisco Fed in 2016. This uses a standard version of the Taylor Rule, which is probably close to one of the rules that Chair Powell is currently using to judge policy tightness. There are many variations of the Taylor Rule which will be routinely presented to Powell, but I suspect that the one incorporated here is close to his preferred version.
Nevertheless, it is important to state that Powell has in the past left his approach to the Taylor Rule rather vague and has specifically said that the median dot of the FOMC for the policy rate shown in the Summary of Economic Projections (SEP) is not intended to provide any clear signal about the policy stance of the Committee, since it emerges from many different opinions without any formal attempt at co-ordination.
Powell said last week that some FOMC members had changed their forecasts as recently as the morning of the press conference, which indicates that the Consumer Price Index (CPI) and Producer Price Index (PPI) inflation releases for November may have been important in changing their view of the degree of persistence in the inflation process. Although there was no mention of the Taylor Rule, it does help to show the importance of declining inflation for the policy rate.
Calculating the Taylor Rule-Implied Policy Rate
Essentially, the Rudebusch-version of the Taylor Rule has three components:
- It takes an estimate of the long run policy rate in nominal terms;
- It then adds the gap between core Personal Consumption Expenditures (PCE) “inflation” and the 2.0% inflation target, with that gap multiplied by a coefficient of 1.5; and
- It subtracts the gap between the actual unemployment rate and the FOMC’s estimate of the equilibrium unemployment rate (u*), multiplied by a coefficient of 2.0. The estimate of u* was 4.0% in the June and September meetings and increased to 4.1% in December.
Note that Rudebusch uses actual core PCE inflation to insert into the calculation, while Powell has recently implied (rather vaguely) that his preferred measure of expected inflation is the forecast for 12-month core PCE inflation, one year ahead.
The result provides an estimate of the policy rate according to the Taylor Rule. The difference between the Taylor Rule-implied rate and the actual policy rate set by the Fed, or predicted by the Fed for a future date, can be described as the degree of extra tightness in monetary policy, relative to the Rule. This is one possible measure of extra policy tightness, compared to “normal”.
Recent Calculations for the Rule
While all the elements inserted into this version of the Taylor Rule are debatable, they seem to produce a coherent story about the development of policy rate settings in the recent past (see Table 1) and are broadly compatible with what Chair Powell has been saying about his thinking on monetary policy. For comparison, I also show the level of the Goldman Sachs Financial Conditions Indicator (GSFCI) at the time of each of the relevant FOMC meetings.
Table 1: Fed Policy Rate and the Taylor Rule (%)
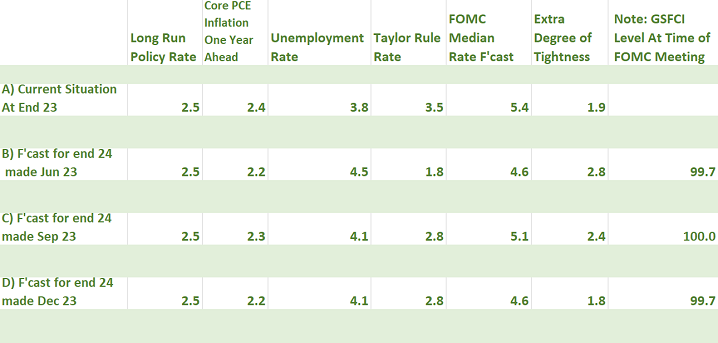
Source: Fulcrum Asset Management, Federal Reserve Board
The table shows four separate calculations for the Rule-based policy rate and extra tightness based on different dates:
Line A) shows the current situation, as it would apply to the Taylor Rule today. Note that this requires a forecast for core PCE inflation, because we assume that this is the definition of “inflation” that they prefer to insert into the Rule. For this forecast, we are guided by the latest FOMC median projection for PCE inflation at the end of 2024. Also note that the long run policy rate (similar to an estimate for r*¹) is assumed to remain at 2.5% throughout. Using these assumptions, the Taylor Rule-implied policy rate today would be 3.5%. Given the current policy rate of 5.4%, the implied degree of extra tightness is 1.9% (rounded), which appears to confirm recent FOMC guidance that the policy setting is extremely tight at the present time.
I now shift focus to what the FOMC has predicted for these variables at the end of 2024. Bear in mind that the one year ahead inflation forecast, as of December 2024, is the forecast inflation rate in December 2025, not 2024.
Line B) shows the forecast variables as they existed in the FOMC’s median economic projections made in June 2023. At that time, the unemployment rate was expected to rise to 4.5% by end 2024, while year-ahead inflation was expected to fall to 2.2%. This produces a Tayor Rule-implied policy rate of 1.8%, but the FOMC gave the relatively hawkish guidance that the policy rate would still be as high as 4.6% at end 2024, suggesting that the extra degree of tightness would be extreme, at 2.8%.
Line C) shows the forecast variables as they existed in the FOMC’s projections made in September 2023. This, of course, was the meeting at which Powell emphasised the much stronger rate of US Gross Domestic Product (GDP) growth that had emerged in the third quarter and suggested that r* may have temporarily risen above the long run policy rate of 2.5%. Both unemployment and core PCE inflation were revised in a hawkish direction compared to the June forecast, and this increased the Taylor Rule-implied policy rate in December 2024 from 1.8% to 2.8%. Given this large change, the hawkishness of Powell’s remarks made sense, but the median FOMC member only increased the forecast policy rate by 0.5%, about half the rise in the Rule-implied rate. This resulted in the implied degree of extra tightness falling slightly to 2.4%, which was not fully in line with Powell’s hawkish shift. The tightening in the GSFCI might help to explain why the policy rate forecast increased by less than the Taylor Rule-implied rate in that meeting.
Line D) shows the latest FOMC forecasts, published at its December meeting. The economic projections show a lower rate of inflation and the same unemployment rate as expected in September. This makes sense in view of the sharply better inflation data that have appeared recently. These projections show a constant Taylor Rule-implied policy rate from September. The key change, however, is that the FOMC members reduced their median policy rate forecast to only 4.6%, which is 0.5% below the September forecast. This was considerably lower than the consensus forecast of 4.9% produced by independent forecasters ahead of the meeting. This enables us to calculate that the implied change in policy tightness at the end of 2024 fell sharply to 2.0%, a much less restrictive policy stance than shown in the June and September FOMC meetings.
How Did Powell Justify the Policy Shift?
It is clear that the downward adjustment to the core PCE inflation forecast justified a minor reduction in the implied policy rate produced by the Taylor Rule in the December meeting, but the degree of tightness relative to the Rule was eased by a much larger amount. In fact, extra policy tightness was eased by 0.6% compared to the September meeting and by 1% compared to the hawkish June meeting.
Several factors may have been in the minds of the median member of the FOMC, as reflected by Chair Powell’s extraordinarily dovish stance at the press conference:
- There is a clear case for arguing that, in a soft-landing scenario such as that shown in the median forecast, there would be no need to keep the very restrictive degree of policy tightness that was deemed necessary at the last two FOMC meetings. This was the implication of a recent speech by Fed Governor Christopher Waller, who mentioned that policy rate cuts might begin in “three, four or five months” if inflation continues to fall towards target. While Powell did not specifically endorse Waller’s reasoning, he did say the following:
“The question of when will it become appropriate to begin dialing back the amount of policy restraint in place…is clearly a topic of discussion out in the world and also a discussion for us at our meeting today”.
- The FOMC was clearly very strongly influenced by the sudden drop in core PCE inflation that seems to have happened in the last two months. This was emphasised by the CPI data for November that appeared on the first day of the meeting, and the PPI print that appeared as late as the second morning. Powell said that these prints had prompted adjustments in the Committee’s expectations for core PCE in November. The market now expects that the monthly rise in November, to be published on 22 December, will be only 0.0-0.1%. That would be consistent with the Fed’s estimate that 12-month core PCE inflation in 2023 Q4 will be 3.1-3.2%, a remarkable drop of 0.5-0.6% since the September FOMC projection.
- Against this, financial conditions have eased somewhat since the September FOMC and have eased dramatically by about 250 basis points since the November meeting (see Graph 1). Given the degree of emphasis placed on Financial Conditions Indexes (FCIs) by Powell in November, there was considerable interest in what he would say about the recent easing in the GSFCI, which has fully reversed the tightening that had occurred since mid summer. Taken in isolation, this would imply that Powell might have shifted towards the more hawkish side in his remarks about the policy rate. However, he dismissed this argument entirely, simply saying this:
“Ultimately financial conditions will come along. But in the meantime, there can be back and forth, and I’m just focused on what’s the right thing for us to do.”
Graph 1: Dramatic Easing in the GSFCI Since The 1 November FOMC Meeting
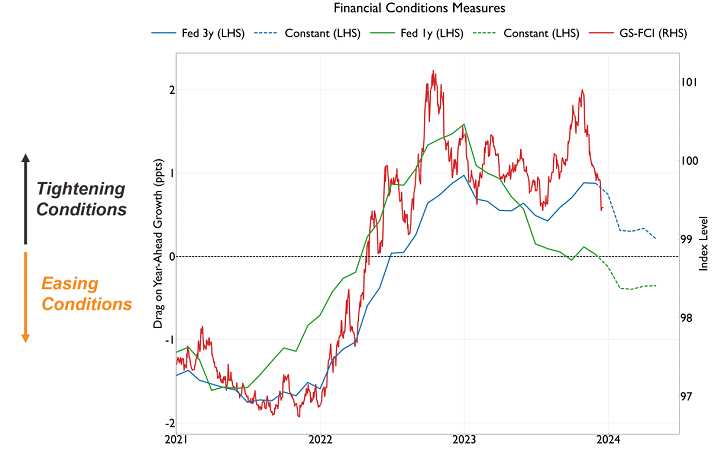
Source: Fulcrum Asset Management, Goldman Sachs
- The FOMC’s dots for future policy rates have recently been viewed as a means of sending a coded message to the markets about the Fed’s intention to keep policy very restrictive until they are confident that inflation is headed towards the 2% target. This was one reason why the market consensus for the median December 2024 dot was 4.9% ahead of the meeting. This hawkish dot seemed even more likely when the November employment data was published on 8 December, showing a lower unemployment rate and higher wage inflation than the previous three employment reports. Despite this, the median dot moved down to 4.6%. While this was 0.5% higher than implied in the Fed Funds futures curve, it was taken as a very dovish signal by the markets. This was surely predictable by Committee members, so the dovish signal must have been, to some extent, deliberate.
The Dots and the Markets
This FOMC median dot shows that three policy rate cuts of 0.25% are now expected by the Committee, compared with the six rate cuts that have been implied by interest rate futures contracts in the aftermath of the meeting (see Graph 2). This is a very wide gap. Who will be right?
Graph 2: Fed Funds Futures Rate Collapses After December FOMC Meeting
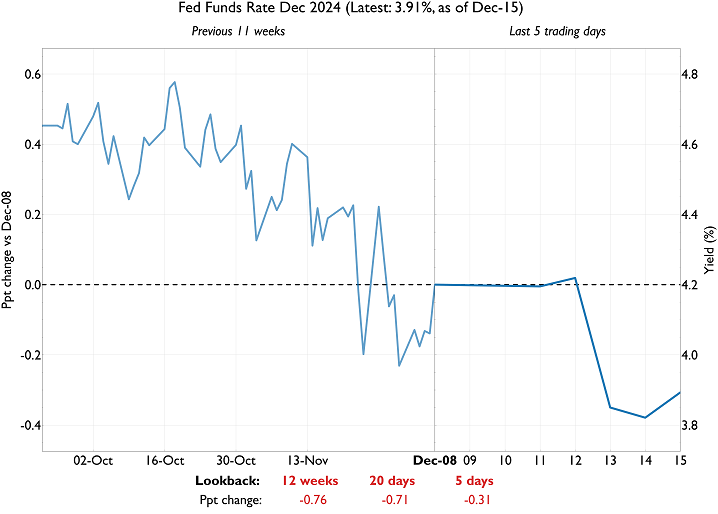
Source: Fulcrum Asset Management, Bloomberg
This will depend, of course, on outcome for the economy in the year ahead, and particularly for the two main variables that enter the Taylor Rule, i.e. PCE (or core PCE) inflation, and the unemployment rate. The Fed forecast is now very firmly in the soft-landing camp, along with many other forecasts for 2024 from leading market economics groups. The Fulcrum economic models also indicate that a soft landing is the most likely outcome.
Some FOMC members have indicated that they might wish to keep policy “restrictive” in a soft-landing scenario and have suggested that this could imply that the real policy rate might be left unchanged as PCE inflation declines. Since the annual rate of PCE inflation is forecast by the FOMC to decline by 0.8% from 2023 Q4 to 2024 Q4, that change would imply that the nominal policy rate should change by about the same amount, which is exactly what the FOMC has predicted. That would leave the policy rate about 0.7% above that currently priced into the market.
However, such an outcome would not make much sense based on the Taylor Rule. Most versions of the Rule, including the one used in this note, indicate that the nominal policy rate should fall by more than the inflation rate, thus reducing the real rate as inflation falls. An alternative way of looking at this is to say that the extra degree of tightness shown in the projections in Table 1 could fall very substantially if a soft landing materialises in 2024. If the degree of tightness falls to 1.0%, instead of the 1.8% outcome implied in the Taylor Rule, then the policy rate could fall to only 3.8%, which is slightly below the rate implied in the market today. And that would still leave the degree of tightness at a level that is historically restrictive.
That seems reasonable under a soft landing, but the outcome would change dramatically if the economy embarks on a different outcome. While improbable, this is certainly not impossible.
The recession predictions that were so common at the start of 2023 have now largely faded away, while the risks of “no landing” have also been reduced in view of the very subdued inflation reports and the sudden lurch towards dovishness by the Fed. Nevertheless, the probabilities attached to these outcomes are not stable. Currently, we keep our soft-landing probability at 65%, with “no landing” at 20% and a recession at 15%. As usual, these probabilities relate to the likely shifts in market opinion in the next 3 months, not to the eventual outcome. As we have seen in the past few months, global markets can swing violently as these probabilities change, and will probably do so again next year.